Filtering nodes and edges in graphs#
When you start working with graphs created from real dataset the graphs quickly become very large. In this case, you may want to filter the nodes and edges in the graph to make it easier to work with. In this notebook, we will show how to filter nodes and edges in a graph using weather_model_graphs.filter_graph(...).
import numpy as np
import matplotlib.pyplot as plt
import weather_model_graphs as wmg
def _create_fake_xy(N=10):
    x = np.linspace(0.0, N, N)
    y = np.linspace(0.0, N, N)
    xy_mesh = np.meshgrid(x, y)
    xy = np.stack([mg_coord.flatten() for mg_coord in xy_mesh], axis=1)  # Shaped (N, 2)
    return xy
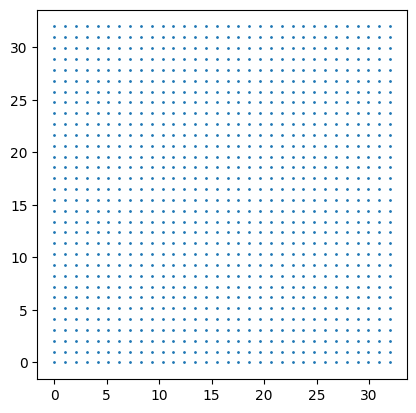
As before, let’s start from some fake grid coordinates (this is where our input/output data will reside)
xy = _create_fake_xy(32)

fig, ax = plt.subplots()
ax.scatter(xy[:, 0], xy[:, 1], s=1)
ax.set_aspect(1)
graph = wmg.create.archetype.create_oskarsson_hierarchical_graph(
    coords=xy, max_num_levels=2
)
graph
<networkx.classes.digraph.DiGraph at 0x7f8b72341490>
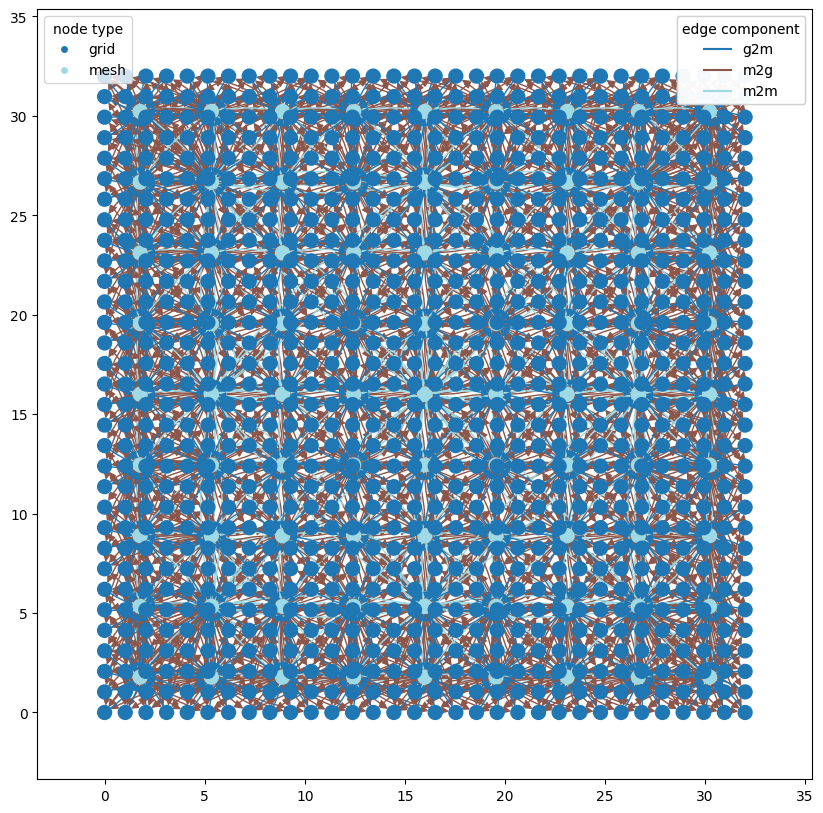
Even with just a two-level hierarchy and only 32x32 grid points this graph is already quite complicated:
wmg.visualise.nx_draw_with_pos_and_attr(
    graph, edge_color_attr="component", node_color_attr="type"
)
<Axes: >
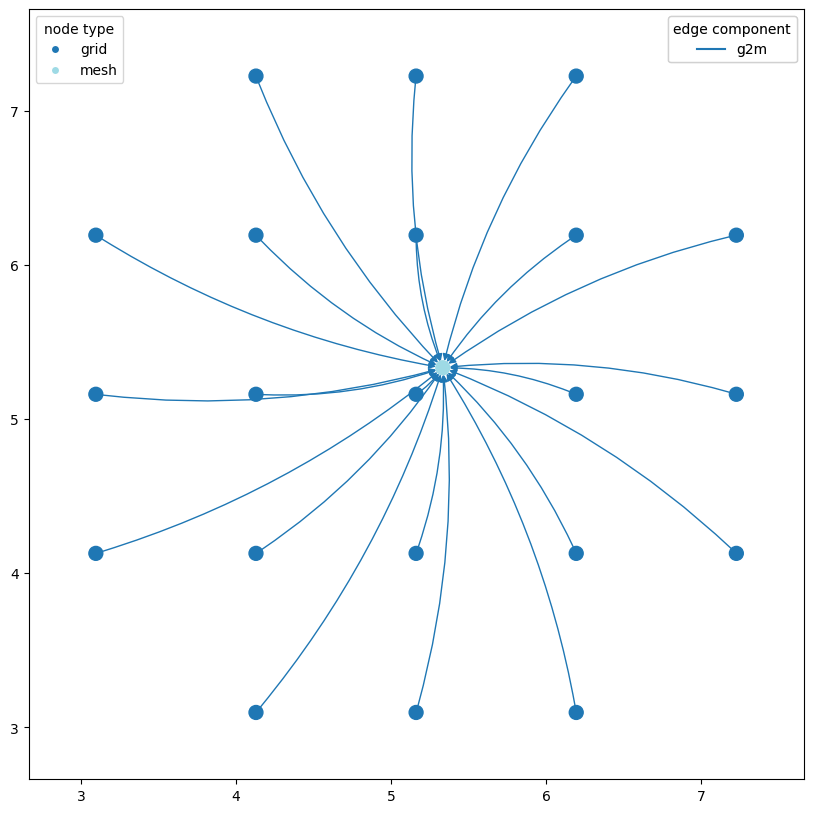
# let's take the 10th mesh node and plot the g2m nodes connected to it
subgraph = wmg.filter_graph(
    wmg.filter_graph(graph, node__type="mesh", node_limit=1, node_offset=10),
    edge__component="g2m",
)

wmg.visualise.nx_draw_with_pos_and_attr(
    subgraph, edge_color_attr="component", node_color_attr="type"
)
<Axes: >
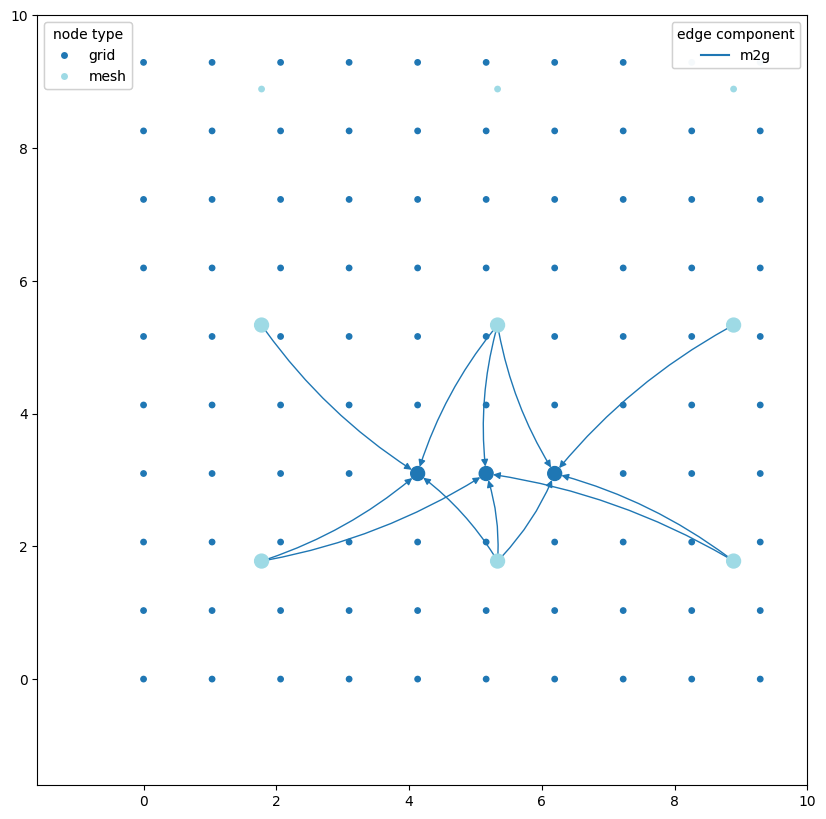
# and similarly lets take the 10th grid node plot the m2g nodes connected to it
n_offset = 100
grid_nodes_highlight_subgraph = wmg.filter_graph(
    wmg.filter_graph(graph, node__type="grid", node_limit=3, node_offset=n_offset),
    edge__component="m2g",
)

grid_nodes_subgraph = wmg.filter_graph(
    graph, node__type__in=["grid", "mesh"], retain="strict"
)

fig, ax = plt.subplots(figsize=(10, 10))
ax.set_aspect(1)
wmg.visualise.nx_draw_with_pos_and_attr(
    ax=ax, graph=grid_nodes_subgraph, node_color_attr="type", node_size=15
)
wmg.visualise.nx_draw_with_pos_and_attr(
    ax=ax,
    graph=grid_nodes_highlight_subgraph,
    edge_color_attr="component",
    node_color_attr="type",
)
ax.set_xlim(None, 10)
ax.set_ylim(None, 10)
(-1.6, 10.0)
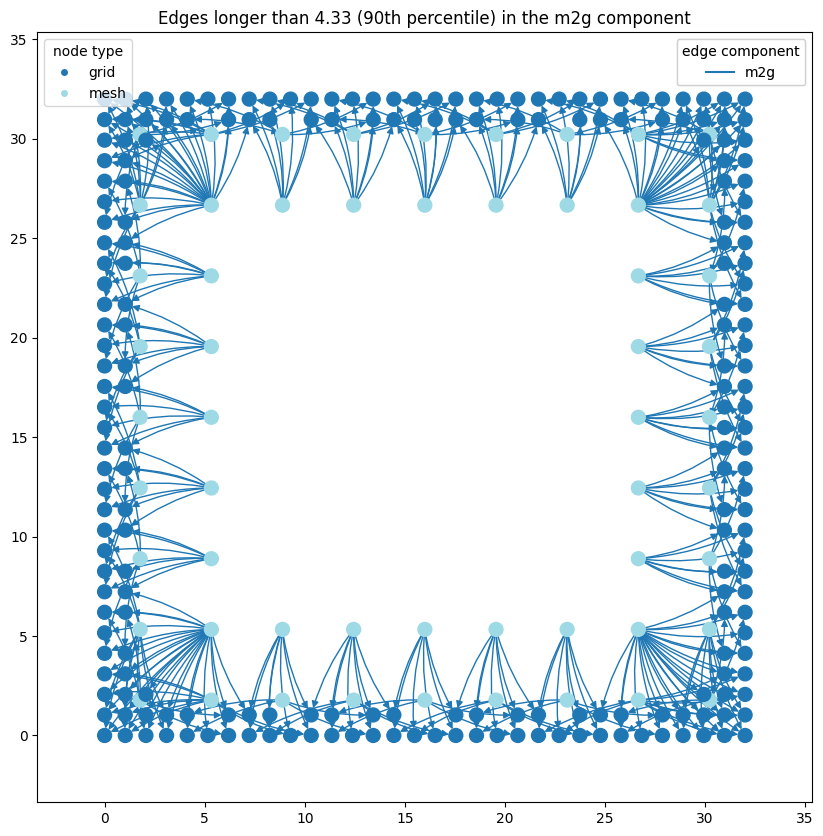
# let's look at the 90th percentile of longest edges, every edge has a `len`
# attribute that gives it length

percentile = 90
graph_m2g_edges = wmg.filter_graph(graph, edge__component="m2g")
lenths = np.array([data["len"] for _, _, data in graph_m2g_edges.edges(data=True)])
len_p = np.percentile(lenths, percentile)
print(f"90th percentile of edge lengths: {len_p:.2f}")

subgraph = wmg.filter_graph(graph_m2g_edges, edge__len__gt=len_p)

fig, ax = plt.subplots(figsize=(10, 10))
wmg.visualise.nx_draw_with_pos_and_attr(
    ax=ax, graph=subgraph, edge_color_attr="component", node_color_attr="type"
)
ax.set_title(
    f"Edges longer than {len_p:.2f} ({percentile}th percentile) in the m2g component"
)
90th percentile of edge lengths: 4.33
Text(0.5, 1.0, 'Edges longer than 4.33 (90th percentile) in the m2g component')
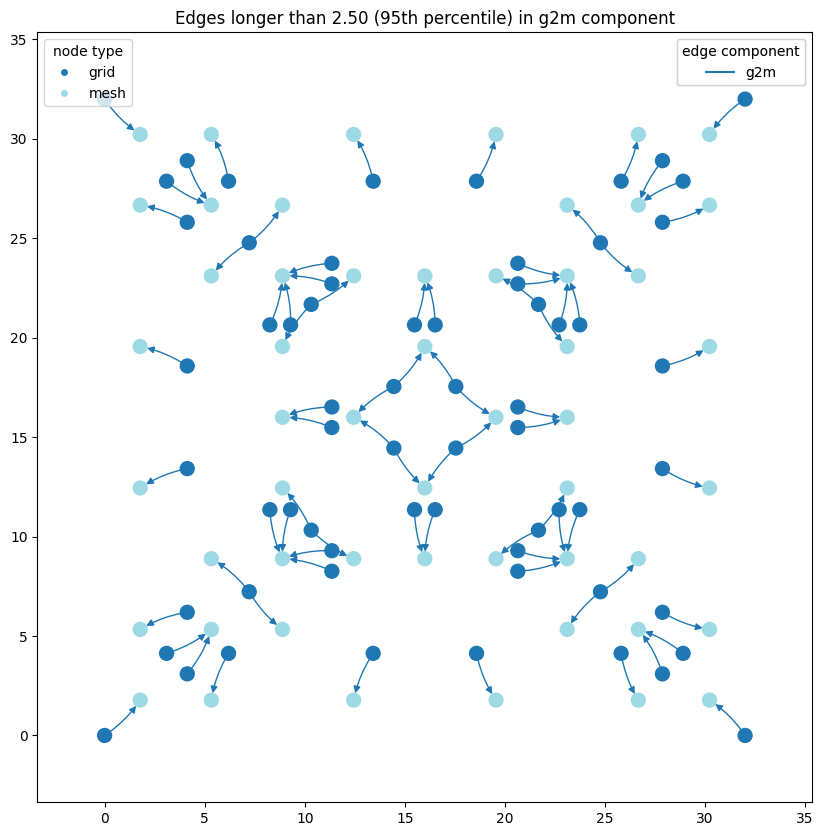
# where are the longest edges in the `g2m` component?
percentile = 95
graph_g2m_edges = wmg.filter_graph(graph, edge__component="g2m")
lenths = np.array([data["len"] for _, _, data in graph_g2m_edges.edges(data=True)])
len_p = np.percentile(lenths, percentile)
print(f"95th percentile of edge lengths: {len_p:.2f}")
subgraph = wmg.filter_graph(graph_g2m_edges, edge__len__gt=len_p)
fig, ax = plt.subplots(figsize=(10, 10))
wmg.visualise.nx_draw_with_pos_and_attr(
    ax=ax, graph=subgraph, edge_color_attr="component", node_color_attr="type"
)
ax.set_title(
    f"Edges longer than {len_p:.2f} ({percentile}th percentile) in g2m component"
)
95th percentile of edge lengths: 2.50
Text(0.5, 1.0, 'Edges longer than 2.50 (95th percentile) in g2m component')
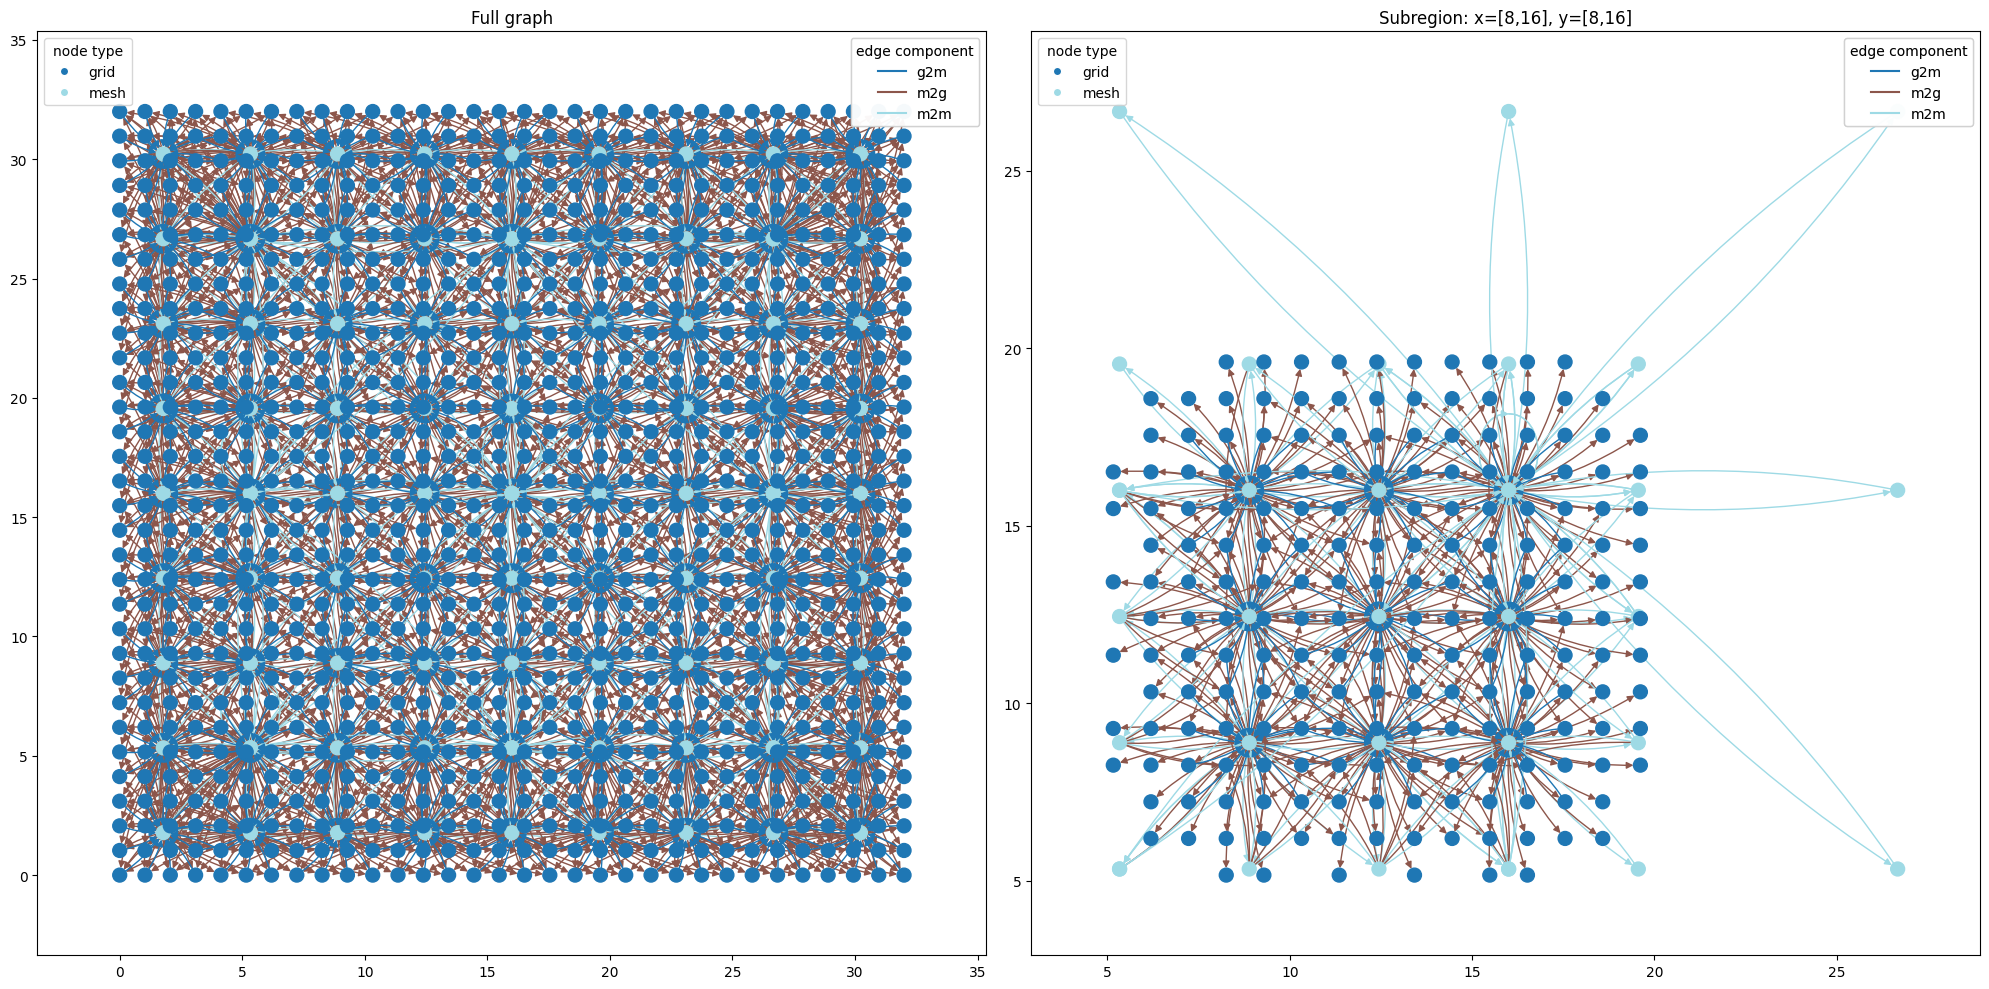
Spatial bounding box filtering#
Sometimes you want to focus on a spatial subregion of the graph. The shorthand filters nodes to those whose attribute falls within the given bounding box.
# filter the entire graph to a spatial subregion
subgraph_bbox = wmg.filter_graph(graph, node__pos__bbox=(8, 16, 8, 16))

fig, axes = plt.subplots(1, 2, figsize=(20, 10))
axes[0].set_title("Full graph")
wmg.visualise.nx_draw_with_pos_and_attr(
    ax=axes[0], graph=graph, edge_color_attr="component", node_color_attr="type"
)
axes[1].set_title("Subregion: x=[8,16], y=[8,16]")
wmg.visualise.nx_draw_with_pos_and_attr(
    ax=axes[1], graph=subgraph_bbox, edge_color_attr="component", node_color_attr="type"
)
plt.tight_layout()
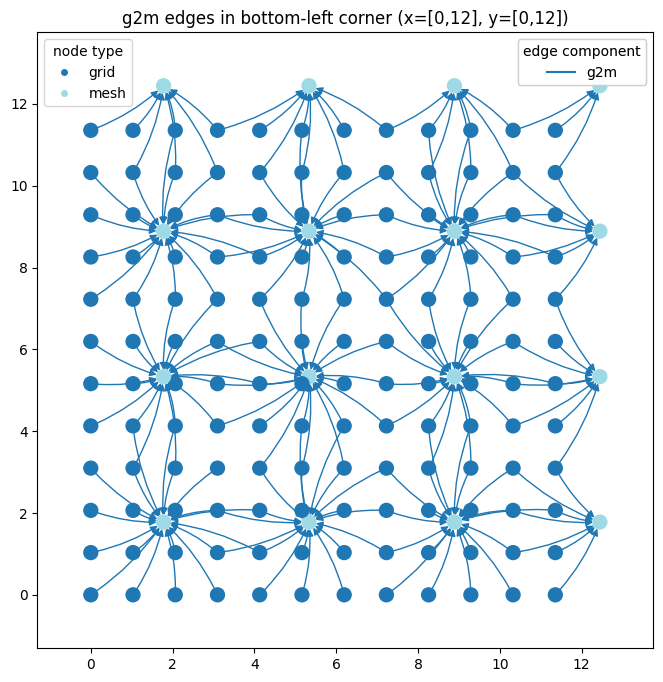
# combine bbox with component filter to inspect g2m edges in a corner region
corner_g2m = wmg.filter_graph(
    wmg.filter_graph(graph, node__pos__bbox=(0, 12, 0, 12)),
    edge__component="g2m",
)

fig, ax = plt.subplots(figsize=(8, 8))
ax.set_aspect(1)
wmg.visualise.nx_draw_with_pos_and_attr(
    ax=ax, graph=corner_g2m, edge_color_attr="component", node_color_attr="type"
)
ax.set_title("g2m edges in bottom-left corner (x=[0,12], y=[0,12])")
Text(0.5, 1.0, 'g2m edges in bottom-left corner (x=[0,12], y=[0,12])')