Using the decode_mask argument during graph creation#
This notebook demonstrates how to use the decode_mask argument when creating a graph with weather-model-graph. The idea behind the argument is to exclude specific grid-points from being decoded to, i.e. the model trained on this graph will not make predictions for these grid-points. This is used for example when training limited-area models, where the model should take input from the boundary grid-points, but not make predictions for them.
import weather_model_graphs as wmg
import numpy as np
import matplotlib.pyplot as plt
def create_fake_irregular_coords(num_grid_points=100):
    """
    Create fake grid points on random coordinates
    """
    rng = np.random.default_rng(seed=42)  # Fixed seed
    # All coordinates in [0,1]^2
    return rng.random((num_grid_points, 2))
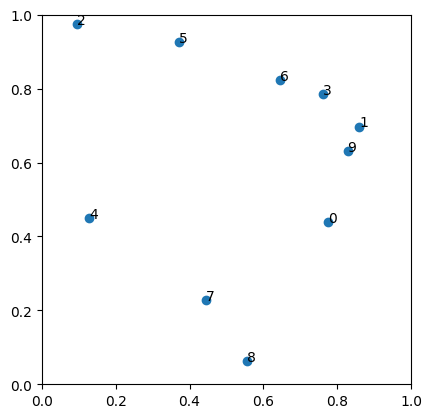
First we create a fake set of irregular coordinates and create a graph from them. In this example we use the Keisler graph creation function, but the same applies to all graph creation functions in weather-model-graph.
xy = create_fake_irregular_coords(10)

fig, ax = plt.subplots()
ax.scatter(xy[:, 0], xy[:, 1])
# add labels
for i, (x, y) in enumerate(xy):
    ax.text(x, y, str(i))
ax.set_xlim(0, 1)
ax.set_ylim(0, 1)
ax.set_aspect("equal")
mesh_node_distance = 0.2
create_graph_fn = wmg.create.archetype.create_keisler_graph

unfiltered_graph = create_graph_fn(coords=xy, mesh_node_distance=mesh_node_distance)
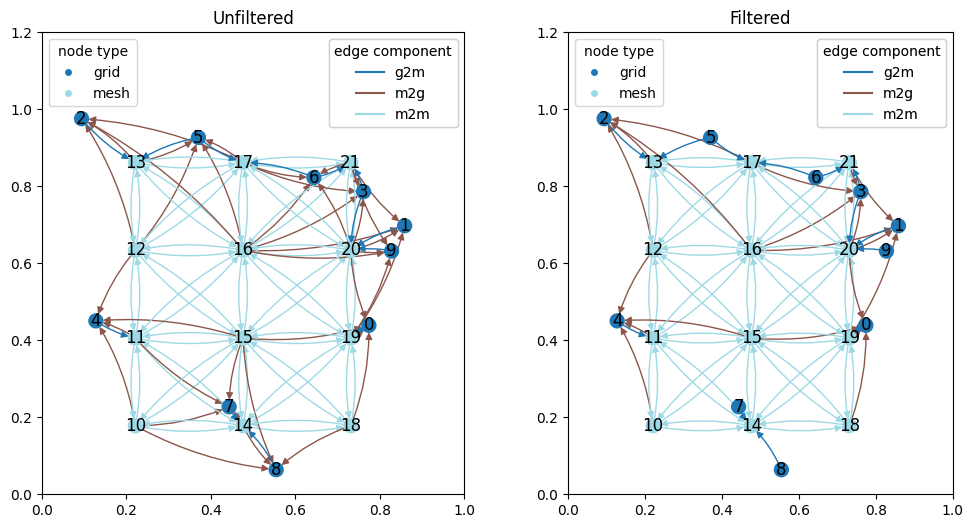
Next we will use the decode_mask argument to only include the first 5 nodes, so that decoding in m2g is done only to these nodes.
decode_mask = np.zeros(xy.shape[0], dtype=bool)
decode_mask[:5] = True
print(decode_mask)
filtered_graph = create_graph_fn(
    coords=xy, mesh_node_distance=mesh_node_distance, decode_mask=decode_mask
)
[ True True True True True False False False False False]
fig, axes = plt.subplots(ncols=2, figsize=(12, 6))

for ax, graph, title in zip(
    axes, (unfiltered_graph, filtered_graph), ("Unfiltered", "Filtered")
):
    wmg.visualise.nx_draw_with_pos_and_attr(
        graph,
        ax=ax,
        node_color_attr="type",
        edge_color_attr="component",
        with_labels=True,
    )
    ax.set_title(title)

print(
    "grid-points removed from filter:",
    np.arange(xy.shape[0])[~decode_mask],
)
print("grid-points kept from filter:", np.arange(xy.shape[0])[decode_mask])
[ax.set_ylim(0, 1.2) for ax in axes]
[ax.set_xlim(0, 1) for ax in axes]
ax.set_aspect("equal")
grid-points removed from filter: [5 6 7 8 9]
grid-points kept from filter: [0 1 2 3 4]