Background#
this section provides an introduction to what graph-based data-driven weather models are and how they work. Inline code using
weather-model-graphsis used to demonstrate different parts of the graph
Current graph-based weather models use the encode-process-decode paradigm on message-passing graphs to do the auto-regressive temporal prediction of the atmospheric weather state to produce a weather forecast. The graphs are directed acyclic graphs (DAGs) with the nodes representing features (physical variables) at a given location in space and the edges representing flow of information. The encode-process-decode paradigm is a three-step process that involves encoding the input data into a latent space, processing the latent space to make predictions, and decoding the predictions to produce the output data.
The graph nodes#
Using the nomenclature of Lam et al 2022 the nodes in weather-model-graphs are split into two types:
grid nodes: representing the physical variables of the atmospheric state at a specific
(x,y)coordinate in the (input) initial state to the model and the (output) prediction of the modelmesh nodes: representing the latent space of the model at specific
(x,y)coordinate in the intermediate (latent) representation of the model
import numpy as np
import weather_model_graphs as wmg

# create some fake cartesian coordinates
def _create_fake_xy(N=10):
    x = np.linspace(0.0, N, N)
    y = np.linspace(0.0, N, N)
    xy_mesh = np.meshgrid(x, y)
    xy = np.stack([mg_coord.flatten() for mg_coord in xy_mesh], axis=1)  # Shaped (N, 2)
    return xy


xy = _create_fake_xy(N=10)

graph = wmg.create.archetype.create_keisler_graph(coords=xy)

# remove all edges from the graph
graph.remove_edges_from(list(graph.edges))

ax = wmg.visualise.nx_draw_with_pos_and_attr(graph, node_color_attr="type")
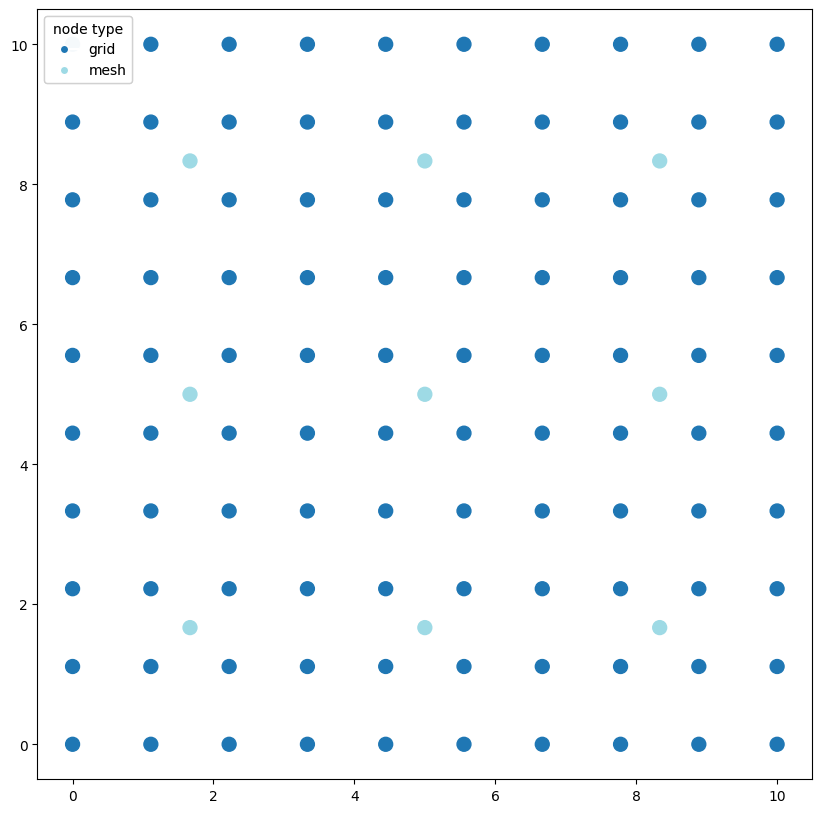
As you can see in the code snippet above, the only input that graph generation in weather-model-graphs requires are the static (x,y) grid coordinates of the atmospheric state as the state changes over time. These coordinates are used to create the grid nodes nodes of the graph, with a node for each (x,y) coordinate.
In addition to grid nodes the graph also contains mesh nodes that represent the latent space of the model at a set of (x,y) coordinates (this is in general a different set of coordinates to the grid nodes coordinates).
The graph edges#
With these two sets of nodes, the graph is constructed by connecting the grid nodes to the mesh nodes and the mesh nodes to each other. The edges between the grid nodes and the mesh nodes represent the encoding of the physical variables into the latent space of the model, while the edges between the mesh nodes represent the processing of the latent space through the time evolution of the atmospheric state.
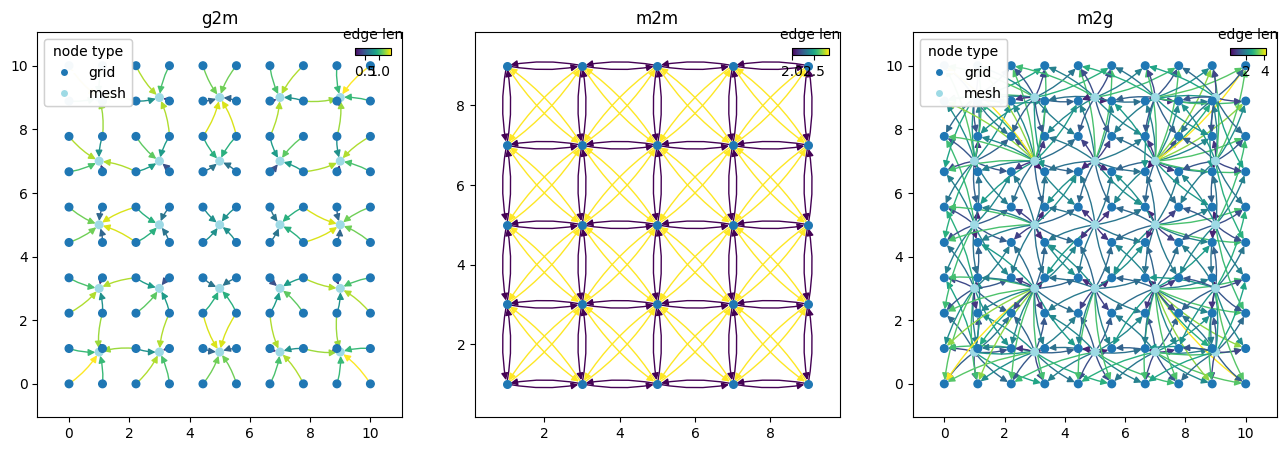
In summary, the complete message-passing graph consists of three components:
grid-to-mesh (
g2m): the encoding compenent, where edges represent the encoding of physical variables into the latent space of the modelmesh-to-mesh (
m2m): the processing component, where edges represent information flow between nodes updating the latent presentation at mesh nodes through the time evolution of the atmospheric statemesh-to-grid (
m2g): the decoding component, where edges represent the decoding of the latent space back into physical variables
Practically, the mesh-to-grid and grid-to-mesh updates can probably also encode some of the time evolution processing, in addition to the latent space encoding/decoding, unless the GNN is trained specifically as an auto-encoder using the same graph as input and output.
import matplotlib.pyplot as plt

graph = wmg.create.archetype.create_keisler_graph(coords=xy, mesh_node_distance=2)
graph_components = wmg.split_graph_by_edge_attribute(graph=graph, attr="component")

fig, axes = plt.subplots(nrows=1, ncols=3, figsize=(16, 5))

for (name, graph), ax in zip(graph_components.items(), axes.flatten()):
    pl_kwargs = {}
    if name == "m2m":
        pl_kwargs = dict(edge_color_attr="len")
    elif name == "g2m" or name == "m2g":
        pl_kwargs = dict(edge_color_attr="len", node_color_attr="type")

    wmg.visualise.nx_draw_with_pos_and_attr(graph, ax=ax, node_size=30, **pl_kwargs)
    ax.set_title(name)